Inventory managagement 101 – How reorder point control works
This is basic stuff, but as usual there is a lack of clear and concise explanations of this on the web. It is also very important, as most methods of inventory control can be reexpressed as some form of reorder point method. Hence this simple introduction. I have also prepared a Reference Sheet that summarises the tutorial and a spreadsheet calculator that you can play with.
Meet Mr Li
Among other things, he sells widgets. I’m not sure what kind of widgets, but he usually sells about 5 each week. Sometimes a few more, sometimes a few less, but usually about 5. Every Friday before he closes up shop, he checks how many widgets he has and then calls his supplier to place an order. The widget supplier is reliable, but it takes him 4 weeks to fulfil an order. Mr Li generally receives delivery of widgets on a Monday morning. Because he orders every week, Mr Li’s average order consists of 5 widgets (though it varies from week to week).
In the normal supply chain inventory management jargon we would say:
Forecast weekly demand (D):     5 units
Supplier lead time (LTs):       4 weeks
Planned order size (Q):         5 units
With such a long lead time, Mr Li gets nervous if his stock drops too low (if he runs out his customers will go to Mr Zhang down the street). So he doesn’t like to end the week with less than 10 widgets in his store-room. That’s about 2 weeks of sales, but it protects him against a period of higher-than-normal sales, or a late delivery. We can add this to our list of parameters:
Safety stock (SS): 10 units
Poor sales
This has been a disappointing week for Mr Li: he only sold 2 widgets. After his regular Monday morning delivery, he had 11 widgets in stock, so this Friday he has 9 widgets left. It looks as if he should order some more. But we are missing an important piece of information: we don’t know how many widgets he has on order. If he’s expecting large deliveries in the future, he shouldn’t add to them just because he is low on stock now. In fact, because it takes 4 weeks for an order to arrive, that wouldn’t even help his immediate problem. Luckily Mr Li has a cool head and long experience of his business.
His purchase records show that he has four orders outstanding. Next Monday he is due a delivery of 5 widgets, and in the following weeks he will get 8, 6 and 7 widgets respectively. In total that makes 26 widgets.
Stock on hand:                  9 units
Stock on order:                 26 units
So perhaps with so much on order it’s not a good idea to order more. Remember that Mr Li wants to end up with 10 widgets in stock on the Friday before he receives the order he’s about to place (so that will be in 4 weeks time). But he can calculate what figure is likely to be: he knows how much stock he has now (stock on hand), he knows how much he is expecting to receive (stock on order), and he knows how much he expects to sell – over 4 weeks with demand of 5 units each week it will be about 20 widgets. We call this last figure the Lead time demand (LTD). Remember that it represents a forecast (our best guess), not what we’re guaranteed to sell.
Mr Li makes the calculation:
Stock on hand + Stock on order - Lead time demand
= 9 + 26 - 20
= 15
Mr Li realises that even if he doesn’t place an order this week, he has plenty of stock. Unless sales pick up, he will probably be OK waiting until next Friday when he will place his normal order (for about 5 widgets).
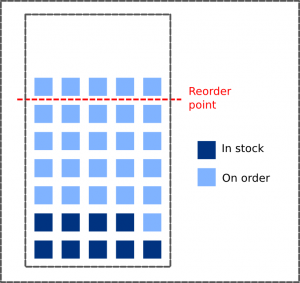
I’m going to rearrange the formulae so they are easier to work with in practice, but let’s have a look at this in a picture first:
 What we have done is add together all the stock in Mr Li’s supply chain and considered it together. You will see I have marked on the picture the Reorder point, and counting widgets you can see that it is set at 30. Why have I chosen this figure?
Well if we subtract from it the Lead time demand (what we’re going to sell before we receive the order we’re about to make) we get 10, the safety stock, or the number of widgets Mr Li wants on the shelf as a target minimum. In other words:
Reorder point (ROP) = Lead time demand + Safety stock
This is a simple but fundamental formula: if you have a demand forecast and a lead time and a safety stock target, you have the ROP. So the reorder rule is:
Order only if Stock on hand + Stock on order <= Reorder point
How much to order
This is our next decision. We could just order 5 widgets each time (we wouldn’t even have to check the reorder point), and if that’s a fair reflection of the weekly demand that would work out OK (and would be very convenient for the supplier, preventing problems further up the supply chain). We call this a rate-based schedule, and I will discuss this approach another time. Mr Li doesn’t do this, because the extra inflexibility of this approach means he would have to hold more stock to achieve the same availability of product.
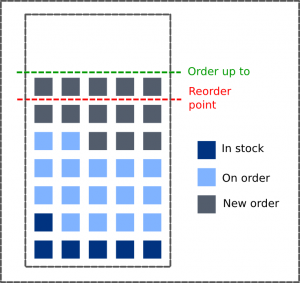
He is aiming to place an order every week of about 5 widgets (one week’s worth of sales). So he sets an Order-up-to level:
Order-up-to level = Reorder point + Planned order size

Consider what happens at Mr Li’s the following Friday.
This week business has been really good. He has sold 8 widgets in total. Luckily he received his delivery of 5 widgets on the Monday morning. If you remember he had 9 in stock at the end of the previous week, so he started the week with 14 widgets.
So now, taking into account the 8 items he sold this week, he has 9 + 5 – 8 = 6 widgets left. Looking at what he has outstanding from his supplier, he sees he also has 8 + 6 + 7 = 21 left on order.
This makes:
  Stock on hand + Stock on order
= 6 + 21
= 27
<= 30 (Reorder point)
Therefore it’s time to place an order. We want to order to bring our total effective stock (on hand + on order) up to 35 (the order-up-to level = ROP + Q). So Mr Li needs to place an order for 35 – 27 = 8. So the rule for the size of the order placed is:
Order placed = ROP + Q - Stock on hand - Stock on order
Further thoughts: Kanban and refinements
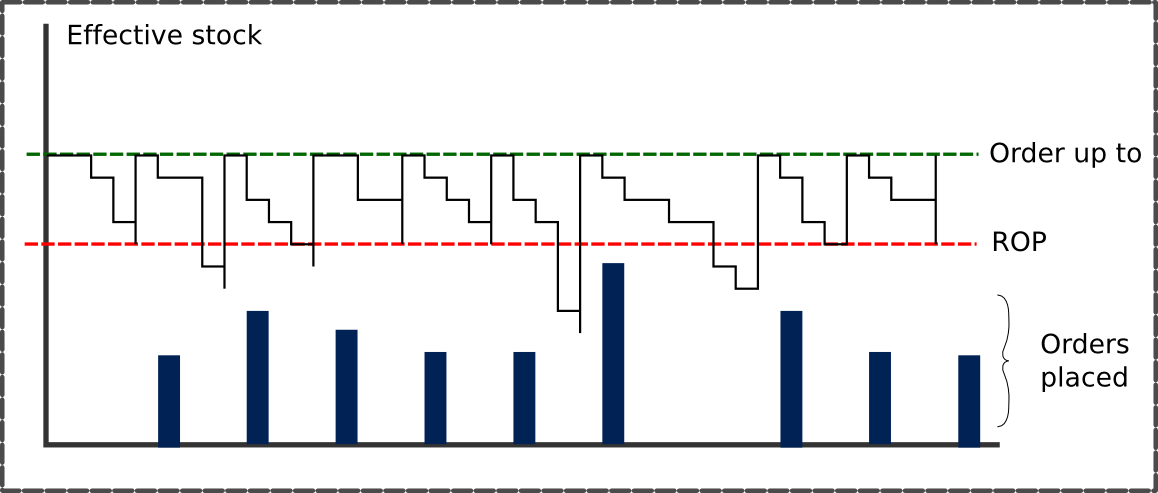
 This chart shows what happens to effective stock over time: it goes up and down as we place orders and use stock, but it never exceeds the Order-up-to level. This means that there is a cap on the total stock in the part of the supply chain we are controlling, and wherever there is a cap like this we are operating a form of Pull system. (Although in the rest of the supply chain pull may not be operating.) In fact, the ROP model describes what is happening in a Kanban system too. Kanban cards are orders to a workstation up the line from one down the line because stock has been consumed to a defined point. The number of Kanbans in the system represents Lead time demand (work in progress at the upstream workstation) plus an element of safety stock (to buffer against congestion, quality issues, machine outages and other causes of time variation). And of course the Lean goal is to reduce set-up times so that we can operate with Q=1.
Probably the simplest variant is the Two bin system: we keep two storage bins of the product. When one is empty, we order another bin’s worth. Get the bins the right size and it’s a very low-tech solution for a stable environment without too many SKUs. It’s equivalent to a two-card kanban loop.
Another variant on the ROP approach is a simple Top-up system. Instead of checking whether the stock has reached the ROP, we replenish to the Order-up-to level every time we review. This is particularly useful when we’re not recording material usage. For example in a workshop there’s little benefit in recording each time we use this or that fixing (we use a lot, they cost pennies, recording would add no value). So these items are usually on “free vend”, and we ensure a regular supply by topping up the storage bin each day or week. Provided we choose the right size bin, this should work well, and we’re using an equivalent ROP of the Order-up-to level minus usage over the review interval (and a zero lead time). In fact there are businesses that provide this as a service – the fixings suppliers are essentially doing VMI (vendor managed inventory) with a weekly top-up.
I have made a couple of simplifications in my account above that you need to understand if you want to put this approach into practice. First, I have assumed there are no back-orders. If we allow a customer to reserve products even if we’ve run out, we need to subtract these back-orders from on hand and on order stock to calculate a true effective stock figure.
Second, Mr Li only reviews his stock once a week. This means that he may drop below his ROP midweek but not place an order until Friday. In effect, he has added some extra lead time to the process. It is usual therefore to define the Effective leadtime as being the supplier leadtime plus half the review frequency – in this case half a week. We would also normally make sure that any other logistical processes were properly accounted for (such as warehouse handling from dock to bin) – for Mr Li these were negligible, but in other contexts the one or two days they add might be significant. So Mr Li’s effective leadtime is actually 4.5 weeks, and the leadtime demand is 22.5 widgets.
This leads to the following observation: all else being equal we want the highest review frequency possible. Kanban creates a kind of continuous review – as soon as a container is empty a card is released. Even ten years ago I was coming across monthly review of stock levels – so that’s over 2 weeks of lead time that could be removed immediately. Where stock levels are system controlled, there is no reason not to have a daily review. Note this does not mean more orders: order size is controlled by our Q parameter, or the difference between Order-up-to and ROP. So this doesn’t mean more work for planners or inbound logistics. It just means lead time reduction.
When does Reorder point control stock being a pull system? This is a topic for another time, but the simple answer is “as soon as we change the ROP”. Demand goes up, we need more stock in the system (this happens in manufacturing too if production rates need to rise). So we raise the ROP. This is where the problems start – the Bullwhip or Forrester Effect, and other nasty things. A topic for another time.
Links
Categories: Supply Chain 101, Supply Chain Resources, Training and Reference.
Tags: excel, Inventory Management, Kanban, Manufacturing, reorder point control, ROP, supply chain management
Comments: 6
Comments
Comment from youssef
Time 3 November 2014 at 7:45 pm
thank you very much for this post.
in the case of topping up system, how we can calculate the quota and the minimum based of daily consumption?
many thanks 🙂
Comment from Martin Arrand
Time 4 November 2014 at 5:52 pm
Hi Youssef,
Well, that is a whole other topic, and I will write about the basics of it some day, I promise.
For now, can I point you to the Reference Sheet (download link at the head of the article). You’ll see that the ROP = LTD + SS, and I give a formula for calculating LTD based on daily consumption. So what remains to calculate is the SS (Safety Stock). Here are some things to think about: the lower the SS, the less you insure yourself against running out of stock during replenishment due to either a late delivery or higher-than-expected consumption. In general, you will want a higher safety stock if you want higher levels of stock availability, if the lead time is longer, if supply is less reliable, and if demand is less predictable.
You can also afford to have more safety stock if the product cost is low (so you are using less working capital), and product storage costs are low (small product, ambient storage conditions).
Make sense?
Thanks for commenting.
Martin
Comment from Martin Arrand
Time 4 November 2014 at 6:10 pm
Good question KB.
Imagine we only check stock levels and then generate orders once every month. If we’re lucky, when we review we could catch a product that has just had enough demand to drop below the ROP. On the other hand, if we’re unlucky the product’s stock might have gone below the ROP 30 days ago, just after we checked the previous month. In this case, we’ve added a whole month to our lead time, just by not checking the stock and raising an order.
Over all products and over time, we would expect to pass the ROP on average halfway between reviews. So, we have effectively added half a review time to the lead time for planning purposes.
We can see from this that it’s a really good idea to review as frequently as possible. Back when everything was manual, or in the early days of automation when computers were slow, monthly or weekly reviews were common. Really we should be on a continuous review, and most systems will certainly review daily. However, if you have a human check in the PO generation process and that human only gets through their work queue every week, then we’re back to weekly review again (or worse) and you have an opportunity to reduce lead time.
I hope I’ve explained that clearly.
Thanks for your comment.
Martin
Comment from Sunny
Time 16 November 2014 at 6:52 pm
Wonderful article..Its just what I was looking for ! Many thanks Martin..More Kanban items coming?
Comment from Martin Arrand
Time 21 November 2014 at 1:50 pm
Thanks Sunny – I’m glad you found that useful. More Kanban posts? Maybe, I’ll let you know.
Martin


Comment from KB
Time 16 April 2014 at 8:18 am
Why is review time divided by 2?