[Daily Statistics] [Hourly Statistics] [URLs] [Entry] [Exit] [Sites] [Referrers] [Search] [Agents] [Countries]
| Monthly Statistics for November 2011 | ||
|---|---|---|
| Total Hits | 6833 | |
| Total Files | 4012 | |
| Total Pages | 4249 | |
| Total Visits | 1981 | |
| Total KBytes | 104480 | |
| Total Unique Sites | 833 | |
| Total Unique URLs | 424 | |
| Total Unique Referrers | 210 | |
| Total Unique User Agents | 308 | |
| . | Avg | Max |
| Hits per Hour | 47 | 276 |
| Hits per Day | 1138 | 1254 |
| Files per Day | 668 | 747 |
| Pages per Day | 708 | 787 |
| Visits per Day | 330 | 358 |
| KBytes per Day | 17413 | 20031 |
| Hits by Response Code | ||
| Code 200 - OK | 4012 | |
| Code 206 - Partial Content | 13 | |
| Code 301 - Moved Permanently | 1090 | |
| Code 302 - Found | 557 | |
| Code 304 - Not Modified | 382 | |
| Code 400 - Bad Request | 1 | |
| Code 403 - Forbidden | 4 | |
| Code 404 - Not Found | 770 | |
| Code 408 - Request Timeout | 3 | |
| Code 500 - Internal Server Error | 1 | |
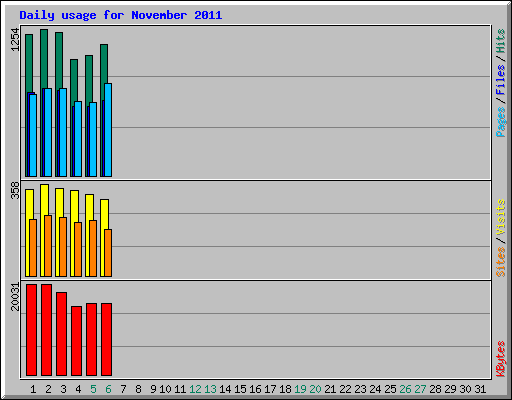
| Daily Statistics for November 2011 | ||||||||||||
|---|---|---|---|---|---|---|---|---|---|---|---|---|
| Day | Hits | Files | Pages | Visits | Sites | KBytes | ||||||
| 1 | 1205 | 17.64% | 709 | 17.67% | 697 | 16.40% | 335 | 16.91% | 218 | 26.17% | 20028 | 19.17% |
| 2 | 1254 | 18.35% | 747 | 18.62% | 745 | 17.53% | 358 | 18.07% | 235 | 28.21% | 20031 | 19.17% |
| 3 | 1226 | 17.94% | 731 | 18.22% | 750 | 17.65% | 340 | 17.16% | 226 | 27.13% | 18107 | 17.33% |
| 4 | 997 | 14.59% | 589 | 14.68% | 639 | 15.04% | 331 | 16.71% | 207 | 24.85% | 14988 | 14.34% |
| 5 | 1027 | 15.03% | 596 | 14.86% | 631 | 14.85% | 319 | 16.10% | 217 | 26.05% | 15636 | 14.97% |
| 6 | 1124 | 16.45% | 640 | 15.95% | 787 | 18.52% | 299 | 15.09% | 180 | 21.61% | 15691 | 15.02% |
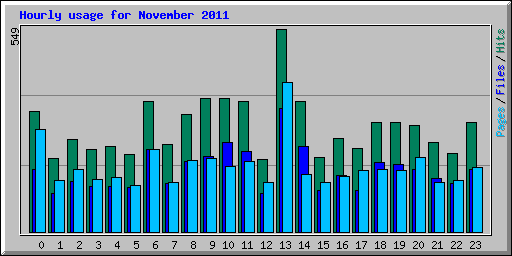
| Hourly Statistics for November 2011 | ||||||||||||
|---|---|---|---|---|---|---|---|---|---|---|---|---|
| Hour | Hits | Files | Pages | KBytes | ||||||||
| Avg | Total | Avg | Total | Avg | Total | Avg | Total | |||||
| 0 | 54 | 327 | 4.79% | 28 | 169 | 4.21% | 46 | 277 | 6.52% | 622 | 3729 | 3.57% |
| 1 | 33 | 199 | 2.91% | 17 | 104 | 2.59% | 23 | 140 | 3.29% | 455 | 2732 | 2.61% |
| 2 | 41 | 250 | 3.66% | 22 | 137 | 3.41% | 28 | 168 | 3.95% | 546 | 3275 | 3.13% |
| 3 | 37 | 224 | 3.28% | 20 | 122 | 3.04% | 23 | 141 | 3.32% | 524 | 3146 | 3.01% |
| 4 | 38 | 232 | 3.40% | 20 | 122 | 3.04% | 24 | 148 | 3.48% | 586 | 3515 | 3.36% |
| 5 | 35 | 210 | 3.07% | 20 | 120 | 2.99% | 20 | 125 | 2.94% | 595 | 3568 | 3.42% |
| 6 | 58 | 352 | 5.15% | 37 | 222 | 5.53% | 37 | 222 | 5.22% | 981 | 5884 | 5.63% |
| 7 | 39 | 237 | 3.47% | 21 | 130 | 3.24% | 22 | 135 | 3.18% | 621 | 3723 | 3.56% |
| 8 | 53 | 319 | 4.67% | 31 | 191 | 4.76% | 32 | 194 | 4.57% | 907 | 5443 | 5.21% |
| 9 | 60 | 360 | 5.27% | 34 | 204 | 5.08% | 33 | 200 | 4.71% | 970 | 5823 | 5.57% |
| 10 | 60 | 362 | 5.30% | 40 | 241 | 6.01% | 29 | 176 | 4.14% | 1097 | 6585 | 6.30% |
| 11 | 58 | 353 | 5.17% | 36 | 219 | 5.46% | 32 | 192 | 4.52% | 926 | 5558 | 5.32% |
| 12 | 32 | 197 | 2.88% | 17 | 105 | 2.62% | 22 | 133 | 3.13% | 469 | 2811 | 2.69% |
| 13 | 91 | 549 | 8.03% | 55 | 335 | 8.35% | 67 | 404 | 9.51% | 1120 | 6718 | 6.43% |
| 14 | 58 | 352 | 5.15% | 38 | 232 | 5.78% | 26 | 156 | 3.67% | 1167 | 7001 | 6.70% |
| 15 | 33 | 201 | 2.94% | 18 | 112 | 2.79% | 22 | 135 | 3.18% | 462 | 2772 | 2.65% |
| 16 | 42 | 252 | 3.69% | 25 | 152 | 3.79% | 25 | 150 | 3.53% | 692 | 4150 | 3.97% |
| 17 | 37 | 227 | 3.32% | 18 | 113 | 2.82% | 27 | 166 | 3.91% | 488 | 2928 | 2.80% |
| 18 | 49 | 295 | 4.32% | 31 | 189 | 4.71% | 28 | 170 | 4.00% | 808 | 4847 | 4.64% |
| 19 | 49 | 295 | 4.32% | 30 | 182 | 4.54% | 27 | 167 | 3.93% | 808 | 4845 | 4.64% |
| 20 | 48 | 288 | 4.21% | 28 | 169 | 4.21% | 33 | 202 | 4.75% | 756 | 4535 | 4.34% |
| 21 | 40 | 243 | 3.56% | 24 | 144 | 3.59% | 22 | 133 | 3.13% | 648 | 3885 | 3.72% |
| 22 | 35 | 213 | 3.12% | 21 | 130 | 3.24% | 23 | 140 | 3.29% | 516 | 3098 | 2.97% |
| 23 | 49 | 296 | 4.33% | 28 | 168 | 4.19% | 29 | 175 | 4.12% | 651 | 3909 | 3.74% |
| Top 10 of 424 Total URLs By KBytes | |||||
|---|---|---|---|---|---|
| # | Hits | KBytes | URL | ||
| 1 | 241 | 3.53% | 39747 | 38.04% | /blog/wp-content/themes/SCV-And02 dev/images/mainpic01.jpg |
| 2 | 210 | 3.07% | 10577 | 10.12% | /blog/ |
| 3 | 686 | 10.04% | 6098 | 5.84% | /blog/feed/ |
| 4 | 9 | 0.13% | 4323 | 4.14% | /blog/wp-content/uploads/ext/ext-all.js |
| 5 | 151 | 2.21% | 4078 | 3.90% | /blog/2007/08/10-ways-to-reduce-inventory-and-improve-service-–-part-1/ |
| 6 | 93 | 1.36% | 2071 | 1.98% | /blog/tag/help-forum/ |
| 7 | 88 | 1.29% | 2045 | 1.96% | /blog/2007/08/10-ways-to-reduce-inventory-and-improve-service-–-part-2/ |
| 8 | 17 | 0.25% | 1976 | 1.89% | /blog/wp-content/uploads/DSC_0096.jpg |
| 9 | 261 | 3.82% | 1870 | 1.79% | /blog/wp-content/themes/SCV-And02 dev/style.css |
| 10 | 59 | 0.86% | 1773 | 1.70% | /blog/2008/11/inventory-managagement-101-how-reorder-point-control-works/ |
| Top 10 of 274 Total Entry Pages | |||||
|---|---|---|---|---|---|
| # | Hits | Visits | URL | ||
| 1 | 686 | 10.04% | 378 | 27.19% | /blog/feed/ |
| 2 | 210 | 3.07% | 214 | 15.40% | /blog/ |
| 3 | 151 | 2.21% | 127 | 9.14% | /blog/2007/08/10-ways-to-reduce-inventory-and-improve-service-–-part-1/ |
| 4 | 59 | 0.86% | 46 | 3.31% | /blog/2008/11/inventory-managagement-101-how-reorder-point-control-works/ |
| 5 | 44 | 0.64% | 42 | 3.02% | /blog/2007/01/humanitarian-logistics-news-cilt-help-forum-11-jan-2007/ |
| 6 | 93 | 1.36% | 34 | 2.45% | /blog/tag/help-forum/ |
| 7 | 28 | 0.41% | 23 | 1.65% | /blog/2009/05/birth-of-lean-review/ |
| 8 | 31 | 0.45% | 18 | 1.29% | /blog/2006/11/best-forecasting-method-for-your-supply-chain/ |
| 9 | 28 | 0.41% | 15 | 1.08% | /blog/2008/11/free-excel-files-for-six-sigma-and-business-statistics/ |
| 10 | 18 | 0.26% | 13 | 0.94% | /blog/2009/04/define-supply-chain-management/ |
| Top 10 of 278 Total Exit Pages | |||||
|---|---|---|---|---|---|
| # | Hits | Visits | URL | ||
| 1 | 686 | 10.04% | 538 | 33.77% | /blog/feed/ |
| 2 | 210 | 3.07% | 192 | 12.05% | /blog/ |
| 3 | 151 | 2.21% | 75 | 4.71% | /blog/2007/08/10-ways-to-reduce-inventory-and-improve-service-–-part-1/ |
| 4 | 79 | 1.16% | 75 | 4.71% | /blog/tag/help-forum/feed/ |
| 5 | 88 | 1.29% | 49 | 3.08% | /blog/2007/08/10-ways-to-reduce-inventory-and-improve-service-–-part-2/ |
| 6 | 33 | 0.48% | 31 | 1.95% | /blog/2007/01/humanitarian-logistics-news-cilt-help-forum-11-jan-2007/feed/ |
| 7 | 59 | 0.86% | 21 | 1.32% | /blog/2008/11/inventory-managagement-101-how-reorder-point-control-works/ |
| 8 | 28 | 0.41% | 17 | 1.07% | /blog/2008/11/free-excel-files-for-six-sigma-and-business-statistics/ |
| 9 | 14 | 0.20% | 15 | 0.94% | /blog/2009/04/define-supply-chain-management/comment-page-1/ |
| 10 | 31 | 0.45% | 14 | 0.88% | /blog/2006/11/best-forecasting-method-for-your-supply-chain/ |
| Top 30 of 833 Total Sites | |||||||||
|---|---|---|---|---|---|---|---|---|---|
| # | Hits | Files | KBytes | Visits | Hostname | ||||
| 1 | 314 | 4.60% | 14 | 0.35% | 212 | 0.20% | 109 | 5.50% | rate-limited-proxy-72-14-199-249.google.com |
| 2 | 285 | 4.17% | 285 | 7.10% | 4290 | 4.11% | 284 | 14.34% | 204.152.18.22 |
| 3 | 202 | 2.96% | 99 | 2.47% | 989 | 0.95% | 1 | 0.05% | 199.19.106.16 |
| 4 | 167 | 2.44% | 82 | 2.04% | 1683 | 1.61% | 1 | 0.05% | pool-71-176-66-151.syrcny.fios.verizon.net |
| 5 | 84 | 1.23% | 68 | 1.69% | 1753 | 1.68% | 51 | 2.57% | crawl-66-249-71-150.googlebot.com |
| 6 | 76 | 1.11% | 5 | 0.12% | 75 | 0.07% | 24 | 1.21% | rate-limited-proxy-209-85-238-245.google.com |
| 7 | 71 | 1.04% | 61 | 1.52% | 1331 | 1.27% | 48 | 2.42% | msnbot-157-55-116-13.search.msn.com |
| 8 | 64 | 0.94% | 50 | 1.25% | 1010 | 0.97% | 1 | 0.05% | 196.40.65.165 |
| 9 | 60 | 0.88% | 48 | 1.20% | 1195 | 1.14% | 3 | 0.15% | sticker01.yandex.ru |
| 10 | 57 | 0.83% | 31 | 0.77% | 503 | 0.48% | 26 | 1.31% | li281-19.members.linode.com |
| 11 | 55 | 0.80% | 46 | 1.15% | 1369 | 1.31% | 4 | 0.20% | 51.60.in-addr.arpa.tm.net.my |
| 12 | 50 | 0.73% | 25 | 0.62% | 376 | 0.36% | 25 | 1.26% | li251-196.members.linode.com |
| 13 | 46 | 0.67% | 6 | 0.15% | 168 | 0.16% | 13 | 0.66% | msnbot-65-52-108-12.search.msn.com |
| 14 | 42 | 0.61% | 24 | 0.60% | 541 | 0.52% | 2 | 0.10% | 69.58.178.59 |
| 15 | 38 | 0.56% | 38 | 0.95% | 0 | 0.00% | 0 | 0.00% | rev.opentransfer.com.71.253.41.72.in-addr.arpa |
| 16 | 36 | 0.53% | 15 | 0.37% | 75 | 0.07% | 2 | 0.10% | 119.27.62.254 |
| 17 | 35 | 0.51% | 27 | 0.67% | 853 | 0.82% | 1 | 0.05% | 173-121-3-124.pools.spcsdns.net |
| 18 | 35 | 0.51% | 28 | 0.70% | 523 | 0.50% | 1 | 0.05% | 200-47-164-110.comsat.net.ar |
| 19 | 35 | 0.51% | 1 | 0.02% | 15 | 0.01% | 10 | 0.50% | rate-limited-proxy-72-14-199-13.google.com |
| 20 | 33 | 0.48% | 27 | 0.67% | 834 | 0.80% | 1 | 0.05% | 195.171.31.72 |
| 21 | 32 | 0.47% | 17 | 0.42% | 605 | 0.58% | 2 | 0.10% | 77.30.28.182 |
| 22 | 31 | 0.45% | 28 | 0.70% | 695 | 0.67% | 1 | 0.05% | 194.204.66.130 |
| 23 | 31 | 0.45% | 24 | 0.60% | 468 | 0.45% | 1 | 0.05% | 202.21.159.253 |
| 24 | 31 | 0.45% | 27 | 0.67% | 848 | 0.81% | 1 | 0.05% | c-98-210-73-59.hsd1.ca.comcast.net |
| 25 | 31 | 0.45% | 27 | 0.67% | 824 | 0.79% | 1 | 0.05% | hgw.hilti.com |
| 26 | 31 | 0.45% | 26 | 0.65% | 812 | 0.78% | 1 | 0.05% | s64-180-96-35.bc.hsia.telus.net |
| 27 | 30 | 0.44% | 15 | 0.37% | 52 | 0.05% | 15 | 0.76% | 95-168-191-160.local |
| 28 | 30 | 0.44% | 26 | 0.65% | 815 | 0.78% | 1 | 0.05% | cpc9-walt13-2-0-cust52.13-2.cable.virginmedia.com |
| 29 | 30 | 0.44% | 6 | 0.15% | 329 | 0.32% | 3 | 0.15% | sticker00.yandex.ru |
| 30 | 29 | 0.42% | 25 | 0.62% | 821 | 0.79% | 1 | 0.05% | 202.68.74.132 |
| Top 10 of 833 Total Sites By KBytes | |||||||||
|---|---|---|---|---|---|---|---|---|---|
| # | Hits | Files | KBytes | Visits | Hostname | ||||
| 1 | 285 | 4.17% | 285 | 7.10% | 4290 | 4.11% | 284 | 14.34% | 204.152.18.22 |
| 2 | 84 | 1.23% | 68 | 1.69% | 1753 | 1.68% | 51 | 2.57% | crawl-66-249-71-150.googlebot.com |
| 3 | 167 | 2.44% | 82 | 2.04% | 1683 | 1.61% | 1 | 0.05% | pool-71-176-66-151.syrcny.fios.verizon.net |
| 4 | 55 | 0.80% | 46 | 1.15% | 1369 | 1.31% | 4 | 0.20% | 51.60.in-addr.arpa.tm.net.my |
| 5 | 71 | 1.04% | 61 | 1.52% | 1331 | 1.27% | 48 | 2.42% | msnbot-157-55-116-13.search.msn.com |
| 6 | 60 | 0.88% | 48 | 1.20% | 1195 | 1.14% | 3 | 0.15% | sticker01.yandex.ru |
| 7 | 64 | 0.94% | 50 | 1.25% | 1010 | 0.97% | 1 | 0.05% | 196.40.65.165 |
| 8 | 202 | 2.96% | 99 | 2.47% | 989 | 0.95% | 1 | 0.05% | 199.19.106.16 |
| 9 | 35 | 0.51% | 27 | 0.67% | 853 | 0.82% | 1 | 0.05% | 173-121-3-124.pools.spcsdns.net |
| 10 | 31 | 0.45% | 27 | 0.67% | 848 | 0.81% | 1 | 0.05% | c-98-210-73-59.hsd1.ca.comcast.net |
| Top 20 of 85 Total Search Strings | |||
|---|---|---|---|
| # | Hits | Search String | |
| 1 | 11 | 9.48% | how to reduce inventory |
| 2 | 5 | 4.31% | dershin's view on supply chain |
| 3 | 4 | 3.45% | global supply chain view |
| 4 | 4 | 3.45% | reduce inventory |
| 5 | 3 | 2.59% | draw reorder point graph in excel |
| 6 | 3 | 2.59% | reorder point graph |
| 7 | 3 | 2.59% | supply chain with excel sheet |
| 8 | 2 | 1.72% | global supply chain view of |
| 9 | 2 | 1.72% | how to decrease inventory |
| 10 | 2 | 1.72% | recommended readings supply chain management |
| 11 | 2 | 1.72% | reducing inventory |
| 12 | 2 | 1.72% | supply chain view |
| 13 | 1 | 0.86% | at what point should i reorder |
| 14 | 1 | 0.86% | best supply chain method |
| 15 | 1 | 0.86% | centre of gravity distribution |
| 16 | 1 | 0.86% | discuss five (5) ways that the lead times within a supply chain |
| 17 | 1 | 0.86% | discuss various ways to reduce inventory |
| 18 | 1 | 0.86% | effects of lead time reduction on safety inventory |
| 19 | 1 | 0.86% | excel graphics supply chain |
| 20 | 1 | 0.86% | excel statistics templates freeware |
| Top 15 of 308 Total User Agents | |||
|---|---|---|---|
| # | Hits | User Agent | |
| 1 | 558 | 8.17% | Mozilla/5.0 (compatible; Baiduspider/2.0; +http://www.baidu.c |
| 2 | 443 | 6.48% | Mozilla/5.0 (compatible; MJ12bot/v1.4.0; http://www.majestic1 |
| 3 | 426 | 6.23% | Feedfetcher-Google; (+http://www.google.com/feedfetcher.html; |
| 4 | 285 | 4.17% | Yammer Feed Eater |
| 5 | 263 | 3.85% | Mozilla/4.0 (compatible; MSIE 8.0; Windows NT 5.1; Trident/4. |
| 6 | 251 | 3.67% | Mozilla/4.0 (compatible; MSIE 8.0; Windows NT 6.1; Trident/4. |
| 7 | 222 | 3.25% | Mozilla/5.0 (compatible; YodaoBot/1.0; http://www.yodao.com/h |
| 8 | 162 | 2.37% | Mozilla/5.0 (compatible; bingbot/2.0; +http://www.bing.com/bi |
| 9 | 153 | 2.24% | Mozilla/5.0 (compatible; MSIE 9.0; Windows NT 6.1; WOW64; Tri |
| 10 | 130 | 1.90% | Mozilla/5.0 (Windows NT 5.1; rv:7.0.1) Gecko/20100101 Firefox |
| 11 | 128 | 1.87% | FTRF: Friendly robot/1.1 |
| 12 | 128 | 1.87% | Mozilla/5.0 (compatible; Googlebot/2.1; +http://www.google.co |
| 13 | 124 | 1.81% | Mozilla/5.0 (Windows NT 6.1; WOW64) AppleWebKit/535.2 (KHTML, |
| 14 | 119 | 1.74% | Mozilla/5.0 (compatible; MSIE 9.0; Windows NT 6.1; Trident/5. |
| 15 | 118 | 1.73% | Mozilla/5.0 (Windows NT 6.1) AppleWebKit/535.2 (KHTML, like G |
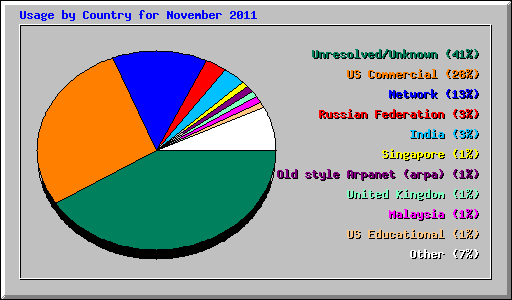
| Top 30 of 47 Total Countries | |||||||
|---|---|---|---|---|---|---|---|
| # | Hits | Files | KBytes | Country | |||
| 1 | 2774 | 40.60% | 1821 | 45.39% | 43738 | 41.86% | Unresolved/Unknown |
| 2 | 1885 | 27.59% | 730 | 18.20% | 19270 | 18.44% | US Commercial |
| 3 | 919 | 13.45% | 598 | 14.91% | 17909 | 17.14% | Network |
| 4 | 200 | 2.93% | 119 | 2.97% | 2654 | 2.54% | Russian Federation |
| 5 | 182 | 2.66% | 141 | 3.51% | 4581 | 4.38% | India |
| 6 | 89 | 1.30% | 52 | 1.30% | 981 | 0.94% | Singapore |
| 7 | 71 | 1.04% | 62 | 1.55% | 834 | 0.80% | Old style Arpanet (arpa) |
| 8 | 70 | 1.02% | 52 | 1.30% | 1668 | 1.60% | United Kingdom |
| 9 | 55 | 0.80% | 46 | 1.15% | 1369 | 1.31% | Malaysia |
| 10 | 36 | 0.53% | 26 | 0.65% | 844 | 0.81% | US Educational |
| 11 | 35 | 0.51% | 28 | 0.70% | 523 | 0.50% | Argentina |
| 12 | 34 | 0.50% | 15 | 0.37% | 398 | 0.38% | Israel |
| 13 | 34 | 0.50% | 29 | 0.72% | 985 | 0.94% | Mexico |
| 14 | 33 | 0.48% | 21 | 0.52% | 526 | 0.50% | Germany |
| 15 | 33 | 0.48% | 20 | 0.50% | 416 | 0.40% | Ukraine |
| 16 | 32 | 0.47% | 14 | 0.35% | 326 | 0.31% | Sweden |
| 17 | 24 | 0.35% | 20 | 0.50% | 610 | 0.58% | Brazil |
| 18 | 24 | 0.35% | 21 | 0.52% | 682 | 0.65% | Canada |
| 19 | 24 | 0.35% | 16 | 0.40% | 404 | 0.39% | Jordan |
| 20 | 23 | 0.34% | 15 | 0.37% | 559 | 0.54% | Romania |
| 21 | 21 | 0.31% | 15 | 0.37% | 338 | 0.32% | Non-Profit Organization |
| 22 | 21 | 0.31% | 16 | 0.40% | 478 | 0.46% | Australia |
| 23 | 21 | 0.31% | 15 | 0.37% | 383 | 0.37% | Belgium |
| 24 | 21 | 0.31% | 11 | 0.27% | 300 | 0.29% | France |
| 25 | 20 | 0.29% | 15 | 0.37% | 428 | 0.41% | Finland |
| 26 | 19 | 0.28% | 15 | 0.37% | 480 | 0.46% | Turkey |
| 27 | 15 | 0.22% | 11 | 0.27% | 454 | 0.43% | Indonesia |
| 28 | 14 | 0.20% | 10 | 0.25% | 434 | 0.42% | US Government |
| 29 | 14 | 0.20% | 13 | 0.32% | 270 | 0.26% | Zimbabwe |
| 30 | 13 | 0.19% | 8 | 0.20% | 241 | 0.23% | Switzerland |