[Daily Statistics] [Hourly Statistics] [URLs] [Entry] [Exit] [Sites] [Referrers] [Search] [Agents] [Countries]
| Monthly Statistics for May 2012 | ||
|---|---|---|
| Total Hits | 41889 | |
| Total Files | 25422 | |
| Total Pages | 23075 | |
| Total Visits | 10148 | |
| Total KBytes | 673544 | |
| Total Unique Sites | 3511 | |
| Total Unique URLs | 544 | |
| Total Unique Referrers | 552 | |
| Total Unique User Agents | 1064 | |
| . | Avg | Max |
| Hits per Hour | 56 | 1156 |
| Hits per Day | 1351 | 3030 |
| Files per Day | 820 | 2394 |
| Pages per Day | 744 | 1180 |
| Sites per Day | 113 | 266 |
| Visits per Day | 327 | 374 |
| KBytes per Day | 21727 | 35758 |
| Hits by Response Code | ||
| Code 200 - OK | 60.69% | 25422 |
| Code 206 - Partial Content | 0.20% | 82 |
| Code 301 - Moved Permanently | 13.25% | 5552 |
| Code 302 - Found | 8.12% | 3401 |
| Code 304 - Not Modified | 5.01% | 2097 |
| Code 400 - Bad Request | 0.01% | 6 |
| Code 403 - Forbidden | 0.05% | 23 |
| Code 404 - Not Found | 12.51% | 5239 |
| Code 405 - Method Not Allowed | 0.01% | 3 |
| Code 408 - Request Timeout | 0.05% | 22 |
| Code 500 - Internal Server Error | 0.10% | 42 |
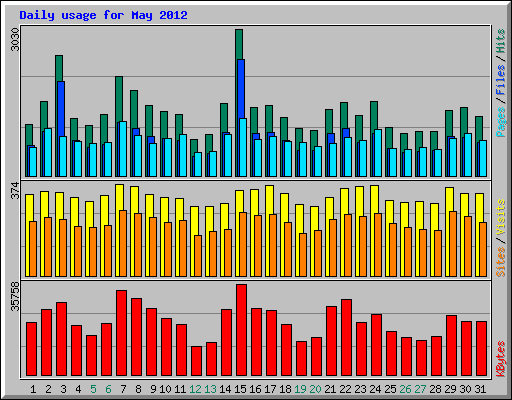
| Daily Statistics for May 2012 | ||||||||||||
|---|---|---|---|---|---|---|---|---|---|---|---|---|
| Day | Hits | Files | Pages | Visits | Sites | KBytes | ||||||
| 1 | 1062 | 2.54% | 635 | 2.50% | 594 | 2.57% | 332 | 3.27% | 222 | 6.32% | 20487 | 3.04% |
| 2 | 1544 | 3.69% | 927 | 3.65% | 972 | 4.21% | 345 | 3.40% | 236 | 6.72% | 25913 | 3.85% |
| 3 | 2489 | 5.94% | 1950 | 7.67% | 810 | 3.51% | 340 | 3.35% | 230 | 6.55% | 28518 | 4.23% |
| 4 | 1184 | 2.83% | 742 | 2.92% | 709 | 3.07% | 321 | 3.16% | 203 | 5.78% | 19427 | 2.88% |
| 5 | 1037 | 2.48% | 589 | 2.32% | 667 | 2.89% | 303 | 2.99% | 197 | 5.61% | 15353 | 2.28% |
| 6 | 1264 | 3.02% | 659 | 2.59% | 692 | 3.00% | 328 | 3.23% | 206 | 5.87% | 20097 | 2.98% |
| 7 | 2057 | 4.91% | 1113 | 4.38% | 1129 | 4.89% | 374 | 3.69% | 266 | 7.58% | 33013 | 4.90% |
| 8 | 1770 | 4.23% | 975 | 3.84% | 834 | 3.61% | 362 | 3.57% | 254 | 7.23% | 30082 | 4.47% |
| 9 | 1451 | 3.46% | 814 | 3.20% | 674 | 2.92% | 333 | 3.28% | 236 | 6.72% | 26309 | 3.91% |
| 10 | 1322 | 3.16% | 770 | 3.03% | 769 | 3.33% | 321 | 3.16% | 217 | 6.18% | 22229 | 3.30% |
| 11 | 1273 | 3.04% | 731 | 2.88% | 853 | 3.70% | 316 | 3.11% | 224 | 6.38% | 19812 | 2.94% |
| 12 | 745 | 1.78% | 405 | 1.59% | 484 | 2.10% | 282 | 2.78% | 165 | 4.70% | 11370 | 1.69% |
| 13 | 853 | 2.04% | 456 | 1.79% | 510 | 2.21% | 283 | 2.79% | 182 | 5.18% | 12636 | 1.88% |
| 14 | 1488 | 3.55% | 888 | 3.49% | 851 | 3.69% | 295 | 2.91% | 191 | 5.44% | 25655 | 3.81% |
| 15 | 3030 | 7.23% | 2394 | 9.42% | 1180 | 5.11% | 349 | 3.44% | 257 | 7.32% | 35758 | 5.31% |
| 16 | 1408 | 3.36% | 885 | 3.48% | 753 | 3.26% | 351 | 3.46% | 244 | 6.95% | 26015 | 3.86% |
| 17 | 1459 | 3.48% | 901 | 3.54% | 821 | 3.56% | 369 | 3.64% | 252 | 7.18% | 25500 | 3.79% |
| 18 | 1210 | 2.89% | 737 | 2.90% | 710 | 3.08% | 334 | 3.29% | 218 | 6.21% | 19928 | 2.96% |
| 19 | 975 | 2.33% | 535 | 2.10% | 681 | 2.95% | 289 | 2.85% | 173 | 4.93% | 13312 | 1.98% |
| 20 | 935 | 2.23% | 517 | 2.03% | 599 | 2.60% | 284 | 2.80% | 183 | 5.21% | 14734 | 2.19% |
| 21 | 1369 | 3.27% | 871 | 3.43% | 663 | 2.87% | 321 | 3.16% | 228 | 6.49% | 26960 | 4.00% |
| 22 | 1506 | 3.60% | 981 | 3.86% | 798 | 3.46% | 355 | 3.50% | 251 | 7.15% | 29766 | 4.42% |
| 23 | 1246 | 2.97% | 697 | 2.74% | 734 | 3.18% | 365 | 3.60% | 243 | 6.92% | 20723 | 3.08% |
| 24 | 1526 | 3.64% | 875 | 3.44% | 966 | 4.19% | 369 | 3.64% | 253 | 7.21% | 23896 | 3.55% |
| 25 | 994 | 2.37% | 571 | 2.25% | 566 | 2.45% | 305 | 3.01% | 213 | 6.07% | 17143 | 2.55% |
| 26 | 883 | 2.11% | 488 | 1.92% | 538 | 2.33% | 299 | 2.95% | 197 | 5.61% | 14560 | 2.16% |
| 27 | 927 | 2.21% | 497 | 1.95% | 579 | 2.51% | 303 | 2.99% | 188 | 5.35% | 13529 | 2.01% |
| 28 | 918 | 2.19% | 520 | 2.05% | 556 | 2.41% | 296 | 2.92% | 185 | 5.27% | 15121 | 2.25% |
| 29 | 1340 | 3.20% | 808 | 3.18% | 772 | 3.35% | 361 | 3.56% | 261 | 7.43% | 23567 | 3.50% |
| 30 | 1402 | 3.35% | 794 | 3.12% | 885 | 3.84% | 337 | 3.32% | 240 | 6.84% | 21106 | 3.13% |
| 31 | 1222 | 2.92% | 697 | 2.74% | 726 | 3.15% | 334 | 3.29% | 217 | 6.18% | 21022 | 3.12% |
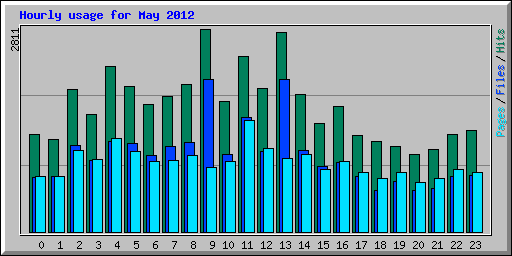
| Hourly Statistics for May 2012 | ||||||||||||
|---|---|---|---|---|---|---|---|---|---|---|---|---|
| Hour | Hits | Files | Pages | KBytes | ||||||||
| Avg | Total | Avg | Total | Avg | Total | Avg | Total | |||||
| 0 | 43 | 1345 | 3.21% | 24 | 754 | 2.97% | 24 | 765 | 3.32% | 750 | 23246 | 3.45% |
| 1 | 41 | 1277 | 3.05% | 24 | 770 | 3.03% | 24 | 768 | 3.33% | 709 | 21991 | 3.27% |
| 2 | 63 | 1977 | 4.72% | 38 | 1191 | 4.68% | 36 | 1129 | 4.89% | 1105 | 34261 | 5.09% |
| 3 | 52 | 1623 | 3.87% | 31 | 988 | 3.89% | 32 | 999 | 4.33% | 844 | 26154 | 3.88% |
| 4 | 74 | 2294 | 5.48% | 40 | 1249 | 4.91% | 41 | 1288 | 5.58% | 1128 | 34977 | 5.19% |
| 5 | 64 | 2010 | 4.80% | 39 | 1227 | 4.83% | 36 | 1116 | 4.84% | 1144 | 35477 | 5.27% |
| 6 | 57 | 1772 | 4.23% | 34 | 1057 | 4.16% | 31 | 977 | 4.23% | 991 | 30711 | 4.56% |
| 7 | 60 | 1874 | 4.47% | 38 | 1182 | 4.65% | 32 | 997 | 4.32% | 1144 | 35479 | 5.27% |
| 8 | 65 | 2045 | 4.88% | 40 | 1245 | 4.90% | 34 | 1066 | 4.62% | 1228 | 38065 | 5.65% |
| 9 | 90 | 2811 | 6.71% | 68 | 2114 | 8.32% | 28 | 891 | 3.86% | 1159 | 35942 | 5.34% |
| 10 | 58 | 1804 | 4.31% | 34 | 1068 | 4.20% | 31 | 972 | 4.21% | 1002 | 31070 | 4.61% |
| 11 | 78 | 2432 | 5.81% | 51 | 1588 | 6.25% | 49 | 1548 | 6.71% | 1259 | 39020 | 5.79% |
| 12 | 64 | 1988 | 4.75% | 36 | 1121 | 4.41% | 37 | 1158 | 5.02% | 1158 | 35898 | 5.33% |
| 13 | 88 | 2757 | 6.58% | 67 | 2106 | 8.28% | 32 | 1011 | 4.38% | 1006 | 31176 | 4.63% |
| 14 | 61 | 1898 | 4.53% | 36 | 1124 | 4.42% | 34 | 1073 | 4.65% | 1021 | 31657 | 4.70% |
| 15 | 48 | 1509 | 3.60% | 29 | 904 | 3.56% | 27 | 860 | 3.73% | 835 | 25897 | 3.84% |
| 16 | 56 | 1744 | 4.16% | 31 | 961 | 3.78% | 31 | 970 | 4.20% | 926 | 28705 | 4.26% |
| 17 | 43 | 1336 | 3.19% | 24 | 773 | 3.04% | 26 | 821 | 3.56% | 714 | 22147 | 3.29% |
| 18 | 40 | 1257 | 3.00% | 18 | 569 | 2.24% | 23 | 734 | 3.18% | 518 | 16068 | 2.39% |
| 19 | 38 | 1183 | 2.82% | 22 | 704 | 2.77% | 26 | 825 | 3.58% | 570 | 17663 | 2.62% |
| 20 | 34 | 1068 | 2.55% | 18 | 570 | 2.24% | 21 | 679 | 2.94% | 475 | 14714 | 2.18% |
| 21 | 36 | 1138 | 2.72% | 19 | 603 | 2.37% | 23 | 742 | 3.22% | 574 | 17781 | 2.64% |
| 22 | 43 | 1348 | 3.22% | 24 | 770 | 3.03% | 28 | 869 | 3.77% | 727 | 22548 | 3.35% |
| 23 | 45 | 1399 | 3.34% | 25 | 784 | 3.08% | 26 | 817 | 3.54% | 739 | 22896 | 3.40% |
| Top 10 of 544 Total URLs By KBytes | |||||
|---|---|---|---|---|---|
| # | Hits | KBytes | URL | ||
| 1 | 1652 | 3.94% | 270233 | 40.12% | /blog/wp-content/themes/SCV-And02 dev/images/mainpic01.jpg |
| 2 | 1011 | 2.41% | 47182 | 7.01% | /blog/ |
| 3 | 1349 | 3.22% | 34305 | 5.09% | /blog/2007/08/10-ways-to-reduce-inventory-and-improve-service-–-part-1/ |
| 4 | 62 | 0.15% | 29026 | 4.31% | /blog/wp-content/uploads/ext/ext-all.js |
| 5 | 3278 | 7.83% | 23149 | 3.44% | /blog/feed/ |
| 6 | 692 | 1.65% | 16520 | 2.45% | /blog/2007/08/10-ways-to-reduce-inventory-and-improve-service-–-part-2/ |
| 7 | 127 | 0.30% | 14429 | 2.14% | /blog/wp-content/uploads/DSC_0096.jpg |
| 8 | 1932 | 4.61% | 13226 | 1.96% | /blog/wp-content/themes/SCV-And02 dev/style.css |
| 9 | 441 | 1.05% | 13062 | 1.94% | /blog/2008/11/inventory-managagement-101-how-reorder-point-control-works/ |
| 10 | 187 | 0.45% | 8175 | 1.21% | /blog/wp-content/uploads/rop2-300x283.png |
| Top 10 of 375 Total Entry Pages | |||||
|---|---|---|---|---|---|
| # | Hits | Visits | URL | ||
| 1 | 3278 | 7.83% | 1914 | 25.92% | /blog/feed/ |
| 2 | 1349 | 3.22% | 1046 | 14.16% | /blog/2007/08/10-ways-to-reduce-inventory-and-improve-service-–-part-1/ |
| 3 | 1011 | 2.41% | 915 | 12.39% | /blog/ |
| 4 | 441 | 1.05% | 340 | 4.60% | /blog/2008/11/inventory-managagement-101-how-reorder-point-control-works/ |
| 5 | 334 | 0.80% | 151 | 2.04% | /blog/2006/11/best-forecasting-method-for-your-supply-chain/ |
| 6 | 285 | 0.68% | 137 | 1.86% | /blog/2009/04/define-supply-chain-management/comment-page-1/ |
| 7 | 241 | 0.58% | 118 | 1.60% | /blog/tag/inventory-management/ |
| 8 | 208 | 0.50% | 107 | 1.45% | /blog/storage-capacity-calculator/ |
| 9 | 134 | 0.32% | 105 | 1.42% | /blog/2007/01/humanitarian-logistics-news-cilt-help-forum-11-jan-2007/ |
| 10 | 107 | 0.26% | 98 | 1.33% | /blog/2009/05/birth-of-lean-review/ |
| Top 10 of 363 Total Exit Pages | |||||
|---|---|---|---|---|---|
| # | Hits | Visits | URL | ||
| 1 | 3278 | 7.83% | 2340 | 29.24% | /blog/feed/ |
| 2 | 1011 | 2.41% | 737 | 9.21% | /blog/ |
| 3 | 1349 | 3.22% | 672 | 8.40% | /blog/2007/08/10-ways-to-reduce-inventory-and-improve-service-–-part-1/ |
| 4 | 692 | 1.65% | 370 | 4.62% | /blog/2007/08/10-ways-to-reduce-inventory-and-improve-service-–-part-2/ |
| 5 | 196 | 0.47% | 191 | 2.39% | /blog/tag/help-forum/feed/ |
| 6 | 441 | 1.05% | 184 | 2.30% | /blog/2008/11/inventory-managagement-101-how-reorder-point-control-works/ |
| 7 | 285 | 0.68% | 142 | 1.77% | /blog/2009/04/define-supply-chain-management/comment-page-1/ |
| 8 | 167 | 0.40% | 132 | 1.65% | /blog/2006/11/best-forecasting-method-for-your-supply-chain/comment-page-1/ |
| 9 | 241 | 0.58% | 123 | 1.54% | /blog/tag/inventory-management/ |
| 10 | 154 | 0.37% | 120 | 1.50% | /blog/2008/11/inventory-managagement-101-how-reorder-point-control-works/comment-page-1/ |
| Top 30 of 3511 Total Sites | |||||||||
|---|---|---|---|---|---|---|---|---|---|
| # | Hits | Files | KBytes | Visits | Hostname | ||||
| 1 | 2249 | 5.37% | 2249 | 8.85% | 7155 | 1.06% | 0 | 0.00% | 37.9.61.64 |
| 2 | 1435 | 3.43% | 1435 | 5.64% | 18754 | 2.78% | 1420 | 13.99% | 204.152.18.22 |
| 3 | 967 | 2.31% | 12 | 0.05% | 145 | 0.02% | 326 | 3.21% | rate-limited-proxy-209-85-238-3.google.com |
| 4 | 802 | 1.91% | 8 | 0.03% | 106 | 0.02% | 273 | 2.69% | rate-limited-proxy-72-14-199-131.google.com |
| 5 | 576 | 1.38% | 36 | 0.14% | 3861 | 0.57% | 1 | 0.01% | 212.175.136.17.dynamic.ttnet.com.tr |
| 6 | 473 | 1.13% | 384 | 1.51% | 4251 | 0.63% | 1 | 0.01% | sr324.2dayhost.com |
| 7 | 407 | 0.97% | 270 | 1.06% | 8274 | 1.23% | 2 | 0.02% | i50.235.154.85.omantel.net.om |
| 8 | 386 | 0.92% | 242 | 0.95% | 3423 | 0.51% | 126 | 1.24% | 208.115.113.84 |
| 9 | 384 | 0.92% | 239 | 0.94% | 3848 | 0.57% | 119 | 1.17% | 208-115-111-68-reverse.wowrack.com |
| 10 | 342 | 0.82% | 113 | 0.44% | 2062 | 0.31% | 61 | 0.60% | nat-dc5.es.bluecoat.com |
| 11 | 324 | 0.77% | 2 | 0.01% | 27 | 0.00% | 113 | 1.11% | rate-limited-proxy-72-14-199-195.google.com |
| 12 | 289 | 0.69% | 193 | 0.76% | 5733 | 0.85% | 97 | 0.96% | 91.201.64.8 |
| 13 | 272 | 0.65% | 109 | 0.43% | 2858 | 0.42% | 3 | 0.03% | hosted-by.leaseweb.com |
| 14 | 226 | 0.54% | 107 | 0.42% | 1560 | 0.23% | 17 | 0.17% | 199.19.249.196 |
| 15 | 209 | 0.50% | 0 | 0.00% | 11 | 0.00% | 0 | 0.00% | 8.218.202.1.static.bjtelecom.net |
| 16 | 195 | 0.47% | 195 | 0.77% | 0 | 0.00% | 0 | 0.00% | rev.opentransfer.com.105.110.162.76.in-addr.arpa |
| 17 | 192 | 0.46% | 156 | 0.61% | 3287 | 0.49% | 126 | 1.24% | crawl-66-249-71-163.googlebot.com |
| 18 | 173 | 0.41% | 115 | 0.45% | 2734 | 0.41% | 80 | 0.79% | crawl-66-249-72-18.googlebot.com |
| 19 | 172 | 0.41% | 76 | 0.30% | 2570 | 0.38% | 40 | 0.39% | 123.126.50.81 |
| 20 | 167 | 0.40% | 82 | 0.32% | 1550 | 0.23% | 1 | 0.01% | 75-170-158-110.desm.qwest.net |
| 21 | 164 | 0.39% | 82 | 0.32% | 1703 | 0.25% | 1 | 0.01% | ec2-107-20-11-235.compute-1.amazonaws.com |
| 22 | 160 | 0.38% | 32 | 0.13% | 1669 | 0.25% | 16 | 0.16% | sticker00.yandex.ru |
| 23 | 153 | 0.37% | 68 | 0.27% | 1316 | 0.20% | 73 | 0.72% | msnbot-157-55-16-230.search.msn.com |
| 24 | 153 | 0.37% | 143 | 0.56% | 2781 | 0.41% | 2 | 0.02% | pro1320.startdedicated.com |
| 25 | 152 | 0.36% | 102 | 0.40% | 1872 | 0.28% | 1 | 0.01% | static.88-198-43-228.clients.your-server.de |
| 26 | 144 | 0.34% | 0 | 0.00% | 1937 | 0.29% | 0 | 0.00% | 50-56-92-47.static.cloud-ips.com |
| 27 | 130 | 0.31% | 39 | 0.15% | 1239 | 0.18% | 13 | 0.13% | 72-46-134.unassigned.userdns.com |
| 28 | 130 | 0.31% | 32 | 0.13% | 831 | 0.12% | 9 | 0.09% | 96-32-87-2.dhcp.gwnt.ga.charter.com |
| 29 | 128 | 0.31% | 101 | 0.40% | 1422 | 0.21% | 5 | 0.05% | bcproxy.ukzn.ac.za |
| 30 | 124 | 0.30% | 78 | 0.31% | 1848 | 0.27% | 1 | 0.01% | static.customer-201-116-128-76.uninet-ide.com.mx |
| Top 10 of 3511 Total Sites By KBytes | |||||||||
|---|---|---|---|---|---|---|---|---|---|
| # | Hits | Files | KBytes | Visits | Hostname | ||||
| 1 | 1435 | 3.43% | 1435 | 5.64% | 18754 | 2.78% | 1420 | 13.99% | 204.152.18.22 |
| 2 | 407 | 0.97% | 270 | 1.06% | 8274 | 1.23% | 2 | 0.02% | i50.235.154.85.omantel.net.om |
| 3 | 2249 | 5.37% | 2249 | 8.85% | 7155 | 1.06% | 0 | 0.00% | 37.9.61.64 |
| 4 | 289 | 0.69% | 193 | 0.76% | 5733 | 0.85% | 97 | 0.96% | 91.201.64.8 |
| 5 | 473 | 1.13% | 384 | 1.51% | 4251 | 0.63% | 1 | 0.01% | sr324.2dayhost.com |
| 6 | 576 | 1.38% | 36 | 0.14% | 3861 | 0.57% | 1 | 0.01% | 212.175.136.17.dynamic.ttnet.com.tr |
| 7 | 384 | 0.92% | 239 | 0.94% | 3848 | 0.57% | 119 | 1.17% | 208-115-111-68-reverse.wowrack.com |
| 8 | 386 | 0.92% | 242 | 0.95% | 3423 | 0.51% | 126 | 1.24% | 208.115.113.84 |
| 9 | 192 | 0.46% | 156 | 0.61% | 3287 | 0.49% | 126 | 1.24% | crawl-66-249-71-163.googlebot.com |
| 10 | 272 | 0.65% | 109 | 0.43% | 2858 | 0.42% | 3 | 0.03% | hosted-by.leaseweb.com |
| Top 30 of 552 Total Referrers | |||
|---|---|---|---|
| # | Hits | Referrer | |
| 1 | 20721 | 49.47% | - (Direct Request) |
| 2 | 579 | 1.38% | http://www.google.com/url |
| 3 | 230 | 0.55% | http://www.google.co.in/url |
| 4 | 166 | 0.40% | http://www.google.co.uk/url |
| 5 | 74 | 0.18% | http://www.google.com/search |
| 6 | 66 | 0.16% | http://www.google.com.au/url |
| 7 | 50 | 0.12% | http://www.google.ca/url |
| 8 | 48 | 0.11% | http://www.google.com.my/url |
| 9 | 44 | 0.11% | http://translate.googleusercontent.com/translate_c |
| 10 | 39 | 0.09% | http://www.google.com.sg/url |
| 11 | 37 | 0.09% | http://www.google.co.za/url |
| 12 | 31 | 0.07% | http://www.bing.com/search |
| 13 | 30 | 0.07% | http://www.google.co.in/search |
| 14 | 30 | 0.07% | http://www.google.com.hk/url |
| 15 | 29 | 0.07% | http://www.google.co.uk/search |
| 16 | 28 | 0.07% | http://www.google.de/url |
| 17 | 26 | 0.06% | http://korop.in/ |
| 18 | 22 | 0.05% | http://search.yahoo.com/search |
| 19 | 22 | 0.05% | http://www.google.com/m |
| 20 | 21 | 0.05% | http://www.google.com.pk/url |
| 21 | 21 | 0.05% | http://www.google.com/imgres |
| 22 | 20 | 0.05% | http://www.google.co.ke/url |
| 23 | 18 | 0.04% | http://kuponshop.net/ |
| 24 | 18 | 0.04% | http://www.google.com.ph/url |
| 25 | 17 | 0.04% | http://www.google.co.id/url |
| 26 | 17 | 0.04% | http://www.google.com.na/url |
| 27 | 17 | 0.04% | http://www.google.fr/url |
| 28 | 16 | 0.04% | http://www.google.ae/url |
| 29 | 16 | 0.04% | http://www.google.nl/url |
| 30 | 15 | 0.04% | http://www.orangeask.com/ |
| Top 20 of 760 Total Search Strings | |||
|---|---|---|---|
| # | Hits | Search String | |
| 1 | 69 | 5.34% | how to reduce inventory |
| 2 | 37 | 2.87% | supply chain view |
| 3 | 28 | 2.17% | reduce inventory |
| 4 | 20 | 1.55% | ways to reduce inventory |
| 5 | 18 | 1.39% | how to reduce lead time in supply chain |
| 6 | 17 | 1.32% | reducing inventory |
| 7 | 15 | 1.16% | how to improve supply chain management |
| 8 | 14 | 1.08% | inventory reduction |
| 9 | 9 | 0.70% | how to decrease inventory |
| 10 | 9 | 0.70% | inventory reduction methods |
| 11 | 8 | 0.62% | supplychainview |
| 12 | 8 | 0.62% | warehouse capacity calculation |
| 13 | 8 | 0.62% | ways to reduce inventory costs |
| 14 | 7 | 0.54% | how to improve inventory |
| 15 | 7 | 0.54% | how to reduce inventory levels |
| 16 | 7 | 0.54% | pakistan flood humanitarian supply chain |
| 17 | 7 | 0.54% | reducing lead time in supply chain |
| 18 | 6 | 0.46% | centre of gravity model |
| 19 | 6 | 0.46% | how to improve a service in supply chain |
| 20 | 6 | 0.46% | how to reduce inventory days |
| Top 15 of 1064 Total User Agents | |||
|---|---|---|---|
| # | Hits | User Agent | |
| 1 | 2307 | 5.51% | Mozilla/5.0 (compatible; Baiduspider/2.0; +http://www.baidu.com/search/spider.html) |
| 2 | 2249 | 5.37% | Mozilla/5.0 (Windows; U; Windows NT 5.1; ru; rv:1.9.1.2) Gecko/20090729 Firefox/3.5.2 (.NET CLR 3.5.30729) |
| 3 | 1650 | 3.94% | Mozilla/5.0 (compatible; Googlebot/2.1; +http://www.google.com/bot.html) |
| 4 | 1482 | 3.54% | Feedfetcher-Google; (+http://www.google.com/feedfetcher.html; 18 subscribers; feed-id=2987087951941674515) |
| 5 | 1428 | 3.41% | Yammer Feed Eater |
| 6 | 1257 | 3.00% | Mozilla/4.0 (compatible;) |
| 7 | 1016 | 2.43% | Mozilla/4.0 (compatible; MSIE 8.0; Windows NT 6.1; Trident/4.0; SLCC2; .NET CLR 2.0.50727; .NET CLR 3.5.30729; .NET CLR 3.0.3 |
| 8 | 1015 | 2.42% | Mozilla/5.0 (compatible; bingbot/2.0; +http://www.bing.com/bingbot.htm) |
| 9 | 876 | 2.09% | Mozilla/5.0 (compatible; MSIE 9.0; Windows NT 6.1; Trident/5.0) |
| 10 | 792 | 1.89% | Mozilla/5.0 (compatible; MSIE 9.0; Windows NT 6.1; WOW64; Trident/5.0) |
| 11 | 778 | 1.86% | Mozilla/5.0 (Windows NT 6.1; WOW64; rv:12.0) Gecko/20100101 Firefox/12.0 |
| 12 | 770 | 1.84% | Mozilla/5.0 (compatible; Ezooms/1.0; ezooms.bot@gmail.com) |
| 13 | 748 | 1.79% | Mozilla/5.0 (compatible; MJ12bot/v1.4.3; http://www.majestic12.co.uk/bot.php?+) |
| 14 | 741 | 1.77% | Feedfetcher-Google; (+http://www.google.com/feedfetcher.html; 7 subscribers; feed-id=14586608098062351304) |
| 15 | 695 | 1.66% | Mozilla/5.0 (compatible; YodaoBot/1.0; http://www.yodao.com/help/webmaster/spider/; ) |
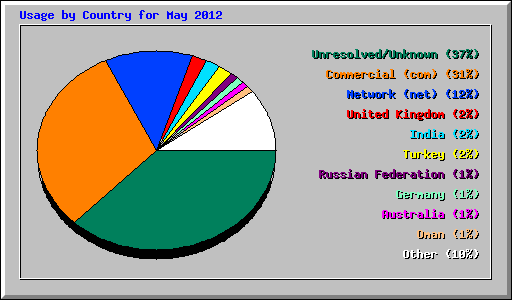
| Top 30 of 82 Total Countries | |||||||
|---|---|---|---|---|---|---|---|
| # | Hits | Files | KBytes | Country | |||
| 1 | 15601 | 37.24% | 11286 | 44.39% | 258829 | 38.43% | Unresolved/Unknown |
| 2 | 12822 | 30.61% | 5436 | 21.38% | 138546 | 20.57% | Commercial (com) |
| 3 | 4819 | 11.50% | 3160 | 12.43% | 101613 | 15.09% | Network (net) |
| 4 | 872 | 2.08% | 542 | 2.13% | 16446 | 2.44% | United Kingdom |
| 5 | 845 | 2.02% | 633 | 2.49% | 23121 | 3.43% | India |
| 6 | 654 | 1.56% | 95 | 0.37% | 5725 | 0.85% | Turkey |
| 7 | 594 | 1.42% | 296 | 1.16% | 8089 | 1.20% | Russian Federation |
| 8 | 559 | 1.33% | 373 | 1.47% | 11426 | 1.70% | Germany |
| 9 | 488 | 1.16% | 346 | 1.36% | 11855 | 1.76% | Australia |
| 10 | 407 | 0.97% | 270 | 1.06% | 8274 | 1.23% | Oman |
| 11 | 371 | 0.89% | 268 | 1.05% | 6812 | 1.01% | South Africa |
| 12 | 278 | 0.66% | 194 | 0.76% | 6256 | 0.93% | Educational (edu) |
| 13 | 268 | 0.64% | 242 | 0.95% | 1163 | 0.17% | Address Routing (arpa) |
| 14 | 267 | 0.64% | 192 | 0.76% | 7111 | 1.06% | Singapore |
| 15 | 231 | 0.55% | 154 | 0.61% | 3953 | 0.59% | Brazil |
| 16 | 215 | 0.51% | 150 | 0.59% | 3971 | 0.59% | Ukraine |
| 17 | 197 | 0.47% | 130 | 0.51% | 4062 | 0.60% | Non-Profit (org) |
| 18 | 197 | 0.47% | 140 | 0.55% | 4042 | 0.60% | Mexico |
| 19 | 144 | 0.34% | 85 | 0.33% | 1935 | 0.29% | Poland |
| 20 | 141 | 0.34% | 110 | 0.43% | 3279 | 0.49% | Thailand |
| 21 | 137 | 0.33% | 101 | 0.40% | 3895 | 0.58% | Netherlands |
| 22 | 122 | 0.29% | 79 | 0.31% | 2293 | 0.34% | Canada |
| 23 | 109 | 0.26% | 68 | 0.27% | 2097 | 0.31% | Sweden |
| 24 | 103 | 0.25% | 80 | 0.31% | 2466 | 0.37% | Pakistan |
| 25 | 102 | 0.24% | 84 | 0.33% | 2381 | 0.35% | Indonesia |
| 26 | 89 | 0.21% | 70 | 0.28% | 2740 | 0.41% | Malaysia |
| 27 | 89 | 0.21% | 65 | 0.26% | 2337 | 0.35% | Portugal |
| 28 | 82 | 0.20% | 50 | 0.20% | 1713 | 0.25% | China |
| 29 | 69 | 0.16% | 57 | 0.22% | 2029 | 0.30% | Japan |
| 30 | 58 | 0.14% | 47 | 0.18% | 1709 | 0.25% | Switzerland |